What is a Key Driver Analysis?
What is affecting your company’s overall satisfaction scores? Price? Location? Turnaround time? All of the above? Conducting a key driver analysis helps you understand consumer behaviors. This special type of analysis also uncovers what is most important to consumers in a specific product or service category. It plays a vital role within new product development, customer satisfaction, loyalty and retention, and new business acquisitions. The key driver analysis ultimately helps you better understand where you should focus your priorities.
Here are five important things to know about this powerful data technique:
- The key driver analysis helps you identify the importance of predictor (independent) variables on your single outcome (dependent) variable – For example, consumers in a certain market say they shop at one specific grocery store more often because its closer to their home. After conducting a market research study, however, we discover that consumers are actually interested in shopping at a specific store if they have a high-quality produce department, offer a broad range of products, and have friendly staff members. Here we see the key driver analysis at work. Even though consumers say they shop stores closer to their homes, their behavior points them to stores with higher-quality produce, a large product selection, and friendly staff.
- Multiple Linear Regression is the most common technique to compute a KDA – Multiple linear regression is one of many strategies used when conducting multivariate analysis. This works by examining the correlations between your independent variables (attributes) to generate the best linear combination to predict the specific outcome variable (overall satisfaction). It provides an R-squared value which quantifies how well the independent variables predict the dependent variable. As an example, an R-squared value of .60 means the independent variables explain 60% of the variation in our dependent variable. The closer we get to a value of 1.0 (100%), the stronger the model is.
- The key driver analysis helps you prioritize your company’s changes/improvements – Key driver analysis not only tells you which variables (attributes) are driving your outcome of interest (overall satisfaction) but also identifies which ones have the strongest influence. By identifying the level of strength, businesses can focus on improving their attributes which have the highest strengths; in turn, this will help boost overall satisfaction scores.
- Different segments within a specific market can be driven by different variables – As an example, aggregate market satisfaction may be driven by high-quality produce, broad product selection, and friendly staff within the stores that consumers like to shop at. If we want to take a deeper dive and uncover behaviors of different segments, the key driver analysis can do that. Millennials, Gen X’ers, and Boomers can be driven by different variables. It is important to identify how these groups are driven, so your marketing and messaging campaigns are specifically tailored to helping you with conversions.
- If our Key Driver Analysis model is good enough, we can predict and simulate with it – We can test the accuracy of any KDA model (as we do with any other predictive model). If it passes muster, we can then use it as a decision-making tool to run what-if scenarios. An example could be if we improve satisfaction with our shipping speed by 5%, what would the impact on customer loyalty be?
Can this Key Driver Analysis be Visualized?
Numbers tell us everything we need to know and visualizing how they work together is important. The key driver analysis can be represented visually by a 2X2 matrix. Likelihood to return to the store will be on the y-axis followed by Importance on the x-axis.
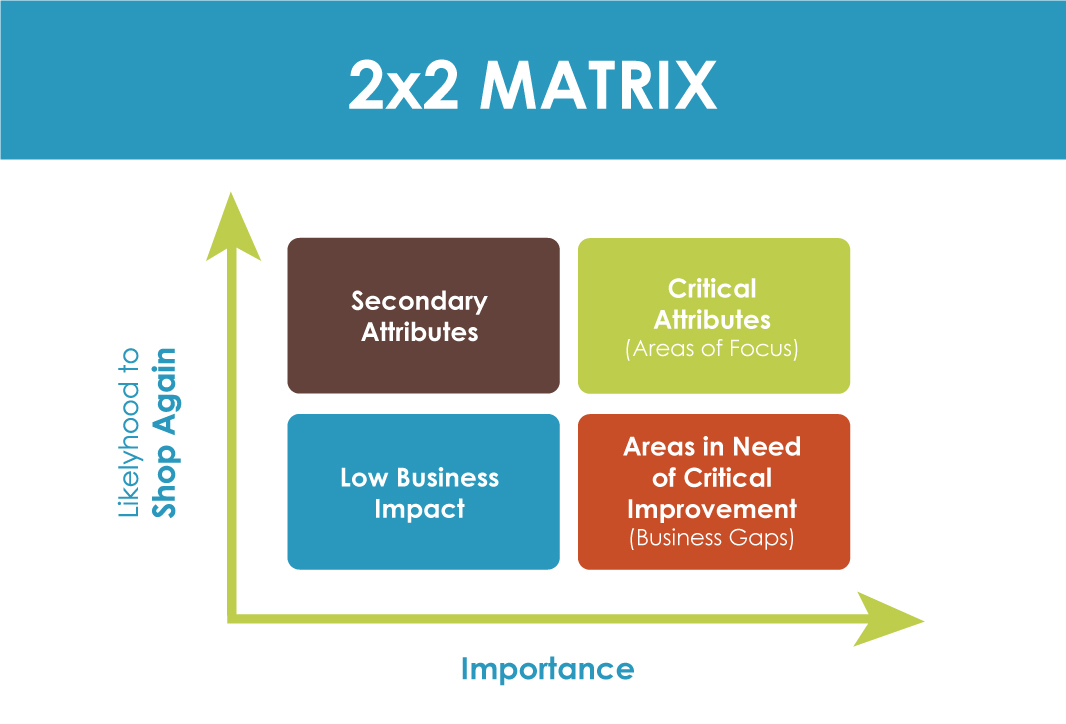
As we conduct our analysis, the attributes of interest will begin to align in these four key regions. We can then start making inferences and recommendations based upon what we see. Attributes landing in the red region are very important to customers but hurt their likeliness to return. These attributes are of a high priority and are causing business gaps. Fixing these attributes is a must! Anything landing in the blue region would be considered low impact. Consumers find attributes here less important and have a low impact on their likeliness to return in the future. Orange region attributes are called secondary. They play a large role in a consumer returning to the store in the future, but they have a low importance rating. Attributes here should have a secondary focus. Finally, green region attributes are critical as they play a major primary role in creating customer retention. Due to their high importance, improving these attributes helps keep customer retention high. Your positive focus is in this region.

Key Driver Analysis Best Practices
The key driver analysis can fail if the attribute statements in your surveys or interviews are rated differently and do not have the same meaning to consumers that they do to you. It is important to provide context around the meaning of each attribute you are testing. As an example, overall value to a customer might mean prices, while you, as a researcher, are thinking in terms of the best deal for your dollar. Keep this in mind for all your attributes as this is a best practice technique that will drive stronger and more accurate data collection.
Long questionnaires that burn out respondents is another recipe for failure. Keep surveys and interviews as short as possible while collecting all the important information that you need. Placing key questions towards the beginning of the survey helps keep your data accurate and free of survey fatigue. Practicing these techniques will propel your data collection accuracy and give you the best data to work with when analyzing and making key business decisions.
In Conclusion
Running and effectively using a key driver analysis will help you uncover consumer behaviors and better understand where you should focus your business priorities to help improve your performance. This is just one of the many different techniques used through our statistical research process when looking for data trends and consumer preferences in a given market. If you are curious as to how your current market share is behaving or have questions about your consumers, reach out to us! We are here to help you grow!